
CX Maturity Assessment for Multi-Location Brands
A 200-location brand can post a healthy NPS and still have guests repeating the same complaints at the same properties. The dashboard confirms the outcome, but leaders still cannot see where the customer journey broke, which operational handoff caused it, or who owns the fix.
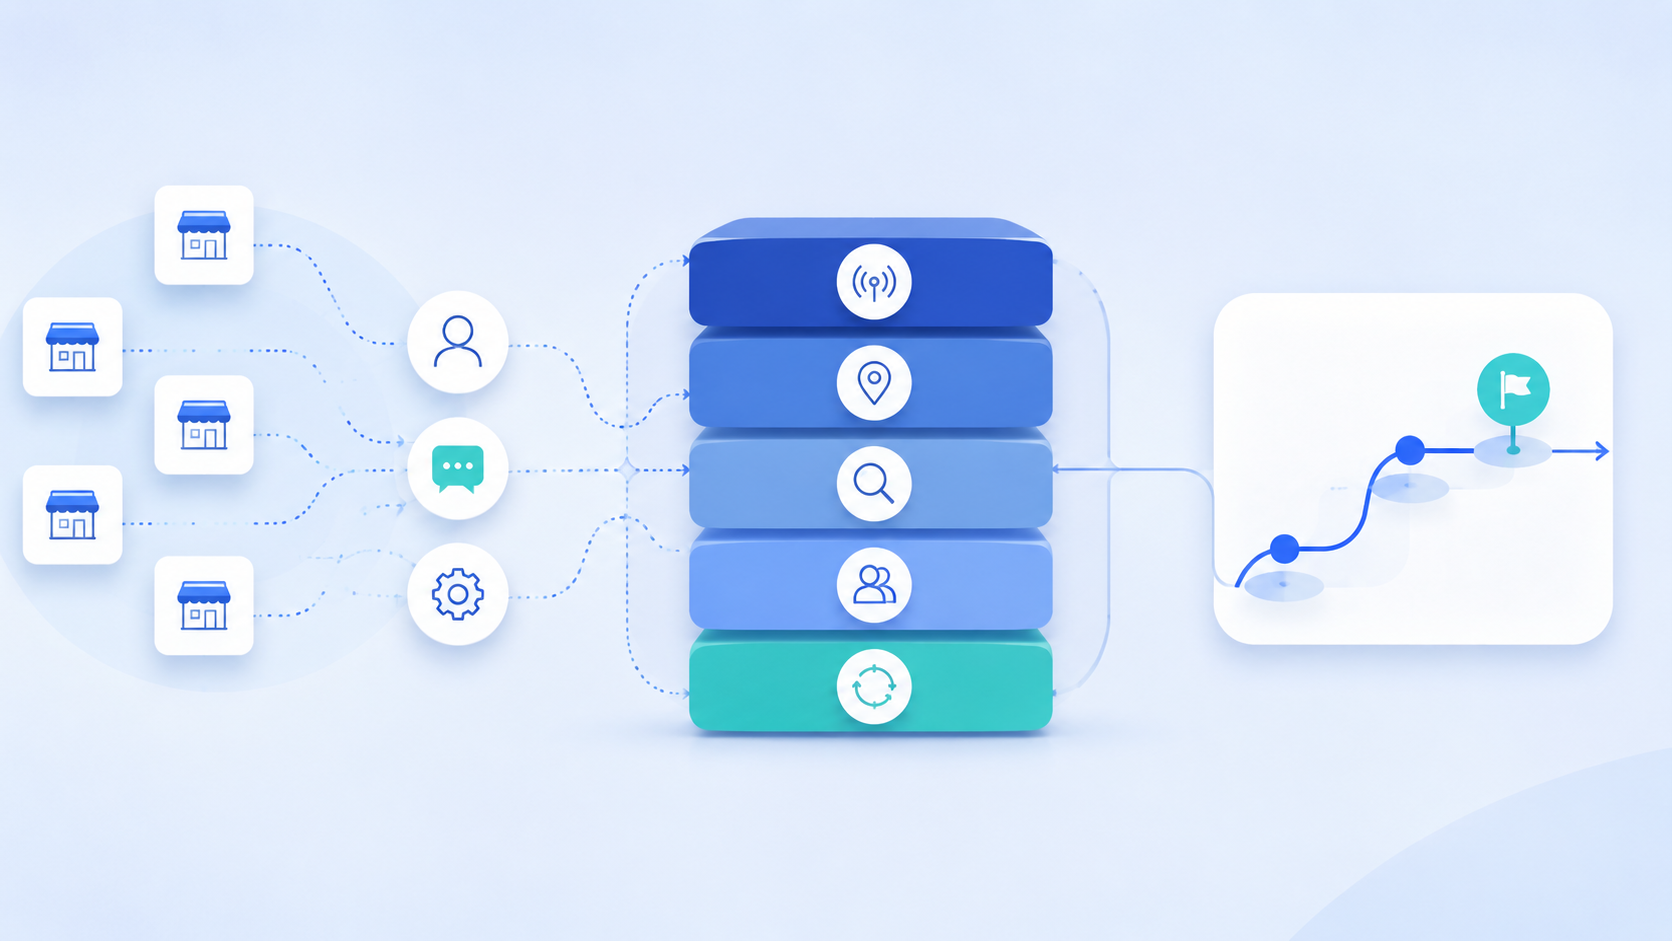
This CX maturity assessment helps operations and customer experience leaders evaluate the system behind customer satisfaction scores. It scores five capabilities: signal coverage, location-level visibility, root-cause depth, action ownership, and closed-loop measurement.
The goal is not a perfect score. It is to identify the next capability required to move from fragmented customer feedback and reactive reporting to continuous, actionable intelligence.
What CX Maturity Actually Measures
A customer experience maturity assessment should evaluate more than survey volume or dashboard sophistication. True CX maturity is the organization’s ability to hear what customers and employees are experiencing, understand the operational causes, decide what to change, and verify whether the change worked.
That means a mature customer experience management program connects:
- Customer feedback from surveys, online reviews, support conversations, and direct research
- Frontline observations from the people delivering the experience
- Customer journey and journey mapping data across critical touchpoints
- Operational and financial KPIs such as conversion, repeat visits, customer loyalty, and customer lifetime value
- Clear governance, action owners, and continuous improvement routines
A mature system turns scattered signals into actionable insights. An immature one produces reports that describe the past.
How to Use This CX Maturity Assessment
Score each statement from 1 to 5:
- Ad hoc: The capability is inconsistent or person-dependent.
- Developing: A process exists, but coverage and adoption are uneven.
- Defined: The capability is documented and used across major teams.
- Managed: Leaders track quality, speed, and business impact.
- Continuous: The capability is embedded in operating rhythms and improves over time.
Add your scores for a maximum of 100 points. Do not let one team complete the assessment alone. Include operations, CX, insights, marketing, field leadership, and analytics so the result reflects the whole system rather than one department’s view.
To make the assessment concrete, follow a fictional 200-location service brand whose enterprise customer satisfaction scores look stable even as a small group of locations generates recurring complaints. Each dimension reveals a different part of the problem.
Dimension 1: Signal Coverage
A customer-centric organization needs more than one listening channel. It must hear from the people who experience and deliver the customer journey.
Score these statements:
- We collect customer feedback at the most important journey touchpoints, not only after the transaction.
- We capture both structured ratings and open-ended explanations.
- We systematically hear from frontline employees about customer friction and operational breakdowns.
- Our voice of the customer program includes quiet, neutral, and dissatisfied customers—not only promoters or extreme reviewers.
What a high score looks like: Your VOC program combines CSAT, NPS, online reviews, customer interviews, support data, and frontline conversations. The signal is timely enough to shape weekly decisions.
Running example: The brand finds that post-transaction surveys overrepresent highly satisfied customers, so it adds customer interviews and frontline conversations at 20 representative locations.
Common maturity gap: Teams mistake more survey invitations for better signal coverage. In practice, annual employee engagement surveys and transactional forms can increase survey fatigue without adding root-cause clarity. Arbor’s guide to why existing employee surveys fall short explains why collection volume alone is not a mature listening strategy.
Dimension 2: Location-Level Visibility
Enterprise averages hide operational variance. A 200-location brand does not deliver one customer experience; it delivers 200 local versions of the brand promise.
Score these statements:
- We can compare customer experience by location, region, role, shift, and touchpoint.
- We can identify whether a poor score reflects a system-wide issue or a local execution gap.
- Field leaders can access relevant customer insights without waiting for a centralized monthly report.
- We can see emerging issues before they materially affect NPS, CSAT, revenue, or retention.
What a high score looks like: Leaders can move from “guest satisfaction is down” to “weekend check-in at three properties is creating the decline.” They can then inspect the operational evidence behind the pattern.
Running example: Portfolio averages look stable, but location-level visibility isolates weekend check-in friction at three properties.
This is where many customer experience maturity models break down. They measure strategy and technology but overlook the distributed operating reality. Multi-location CX capabilities must make local variance visible without overwhelming leaders with dashboards.
Dimension 3: Root-Cause Depth
A mature CX strategy does not stop at sentiment. It explains the process, policy, handoff, tool, staffing pattern, or expectation gap producing the outcome.
Score these statements:
- We routinely ask why a customer gave a score rather than treating the score as the finding.
- We can connect customer symptoms to operational causes.
- We preserve supporting quotes and context so leaders can validate the interpretation.
- We can distinguish isolated anecdotes from recurring patterns across locations.
What a high score looks like: Customer insights include named themes, root causes, affected segments, supporting evidence, and an estimate of business impact. Predictive analytics may help identify risk, but leaders can also understand the reasoning behind it.
Running example: Open-ended customer feedback and frontline observations trace the complaints to a reservation-to-front-desk handoff rather than employee attitude.
Frontline teams are often the missing source. They see how internal processes become customer problems. Arbor’s article on how frontline teams decode what customers actually need shows how operational context can explain patterns that conventional feedback misses.
Dimension 4: Action Ownership and CX Governance
Insights do not create value until someone is accountable for acting on them.
Score these statements:
- Every material CX finding has a named owner and deadline.
- We prioritize actions using customer impact, operational feasibility, and financial value.
- Our CX governance model defines who reviews findings, approves changes, and resolves cross-functional blockers.
- Leaders can see whether agreed actions are open, in progress, completed, or stalled.
What a high score looks like: The CX roadmap is tied to business cases. Experience design, operations, training, digital, and technology teams know their responsibilities. The governance model prevents customer feedback from dying in a dashboard.
Running example: Operations owns the handoff fix, technology owns the data flow, and field leaders own adoption deadlines across the affected locations.
A useful CX governance cadence includes a weekly operating review for urgent friction, a monthly cross-functional review for recurring themes, and a quarterly executive review for investments and CX strategy. The meeting should focus on decisions, not presentation theater.
Dimension 5: Closed-Loop Measurement
The final test of CX maturity is whether the organization can prove that action changed the experience.
Score these statements:
- We establish a baseline before launching major CX initiatives.
- We measure adoption and friction during implementation, not only after rollout.
- We connect customer experience changes to key performance indicators and commercial outcomes.
- We tell employees and customers what changed because of their feedback.
What a high score looks like: The organization tracks a full loop: signal, insight, decision, action, outcome. Continuous improvement is visible. Teams know whether a fix improved customer satisfaction, conversion, customer loyalty, or customer lifetime value.
Running example: The team compares room-ready accuracy, check-in wait time, NPS, customer satisfaction, and repeat visits before and after the change to verify whether the fix worked.
Closing the loop also protects participation rates. People provide more constructive feedback when they see evidence that someone listened. This is especially important when organizations want employees to share candid operational truth.
Interpret Your CX Maturity Level
20–39: Fragmented
Your organization collects data, but CX is largely reactive. Customer feedback sits in separate tools, ownership is unclear, and business decisions depend on anecdotes. The immediate priority is to define critical touchpoints, consolidate core signals, and create a simple action process.
40–59: Developing
You have a formal CX strategy and some reliable reporting, but customer journey visibility and execution vary across teams or locations. Build common definitions, standardize segmentation, and strengthen the connection between customer insights and operations.
60–79: Managed
Your CX maturity model is working. Leaders can identify patterns and assign actions, but gaps remain in speed, root-cause depth, or closed-loop measurement. Focus the CX roadmap on continuous listening, stronger frontline coverage, and clearer business impact.
80–100: Continuous
CX capabilities are embedded in the operating model. Leaders receive timely intelligence, local teams know what to fix, and the organization can activate insights quickly. The next step is to improve proactive detection, predictive analytics, and portfolio-wide learning without losing human context.
Turn the Score Into a 90-Day CX Roadmap
Choose the lowest-scoring dimension and build one measurable improvement around it.
Days 1–30: Define. Select one high-value customer journey, identify the operational owner, map existing signal sources, and document the decision the team needs to make.
Days 31–60: Listen and diagnose. Collect customer and frontline conversations across representative locations. Compare structured ratings with open-ended reasoning. Identify themes, root causes, and location variance.
Days 61–90: Act and measure. Assign actions, establish leading and lagging KPIs, communicate changes, and repeat the listening cycle to test whether the experience improved.
This approach makes digital transformation practical. Instead of buying another platform and hoping behavior changes, the organization builds a repeatable operating loop around a real business question.
From Customer Feedback to Continuous Intelligence
The most important question in a CX maturity assessment is not “How much data do we have?” It is “How reliably can we turn what people experience into a better operating decision?”
Arbor helps multi-location enterprises capture voice-based conversations with frontline employees, customers, guests, and mystery shoppers, then convert them into themes, root causes, and prioritized recommendations. It complements existing customer experience systems by providing the contextual intelligence that scores and dashboards often miss. Learn more about Arbor’s frontline research platform or book a conversation with the team.
CX Maturity Assessment FAQ
Q: What Is a CX Maturity Assessment?
A CX maturity assessment evaluates how well an organization collects customer feedback, interprets customer insights, governs action, and measures results. It provides a practical view of the organization’s current CX maturity level.
Q: How Often Should a Company Repeat the Assessment?
Repeat it every six to twelve months, and after major changes to the customer journey, operating model, or technology stack. The score matters less than evidence of improved capabilities.
Q: Is NPS Enough to Measure Customer Experience Maturity?
No. NPS is a useful outcome metric, but it does not measure root-cause depth, location visibility, action ownership, or closed-loop execution. Mature programs combine NPS with CSAT, qualitative feedback, operational KPIs, and customer journey evidence.